Science × Data × Design

Turning Science into
Clear, Impactful Visuals

I transform complex data and scientific findings into pedagogical figures and interactive visualizations that tell a story and engage your audience.

Services

From raw data to publication-ready figures — scientific precision meets design clarity at every step.

📊

Storytelling with Visuals

We combine narrative and design to help your audience understand and act on your findings.

Storytelling example
🔬

Scientific Posters

Pedagogical diagrams and schematics tailored for publications, conference posters, reports, and educational material.
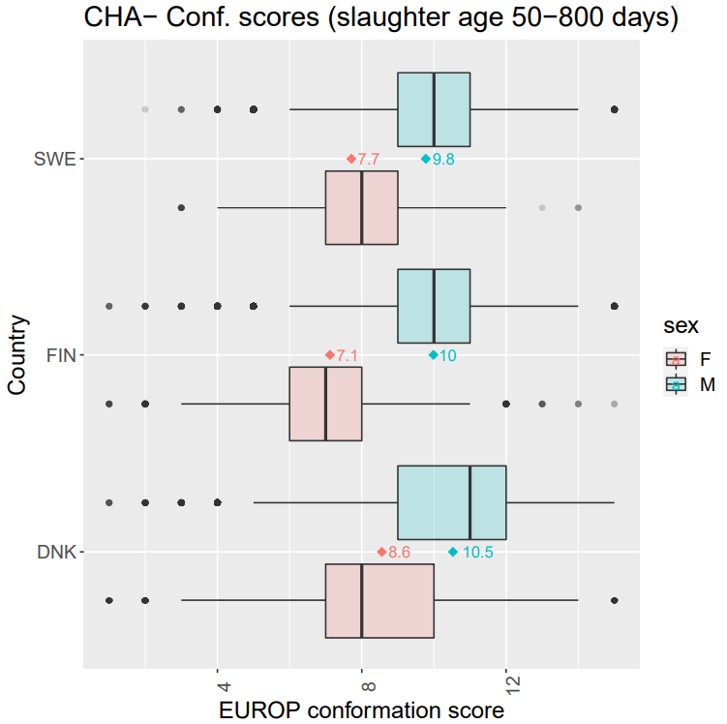
Storytelling example
📈

Data Visualization

Interactive charts and figures that make complex analyses clear and engaging for specialist and general audiences alike.

Storytelling example
🧬

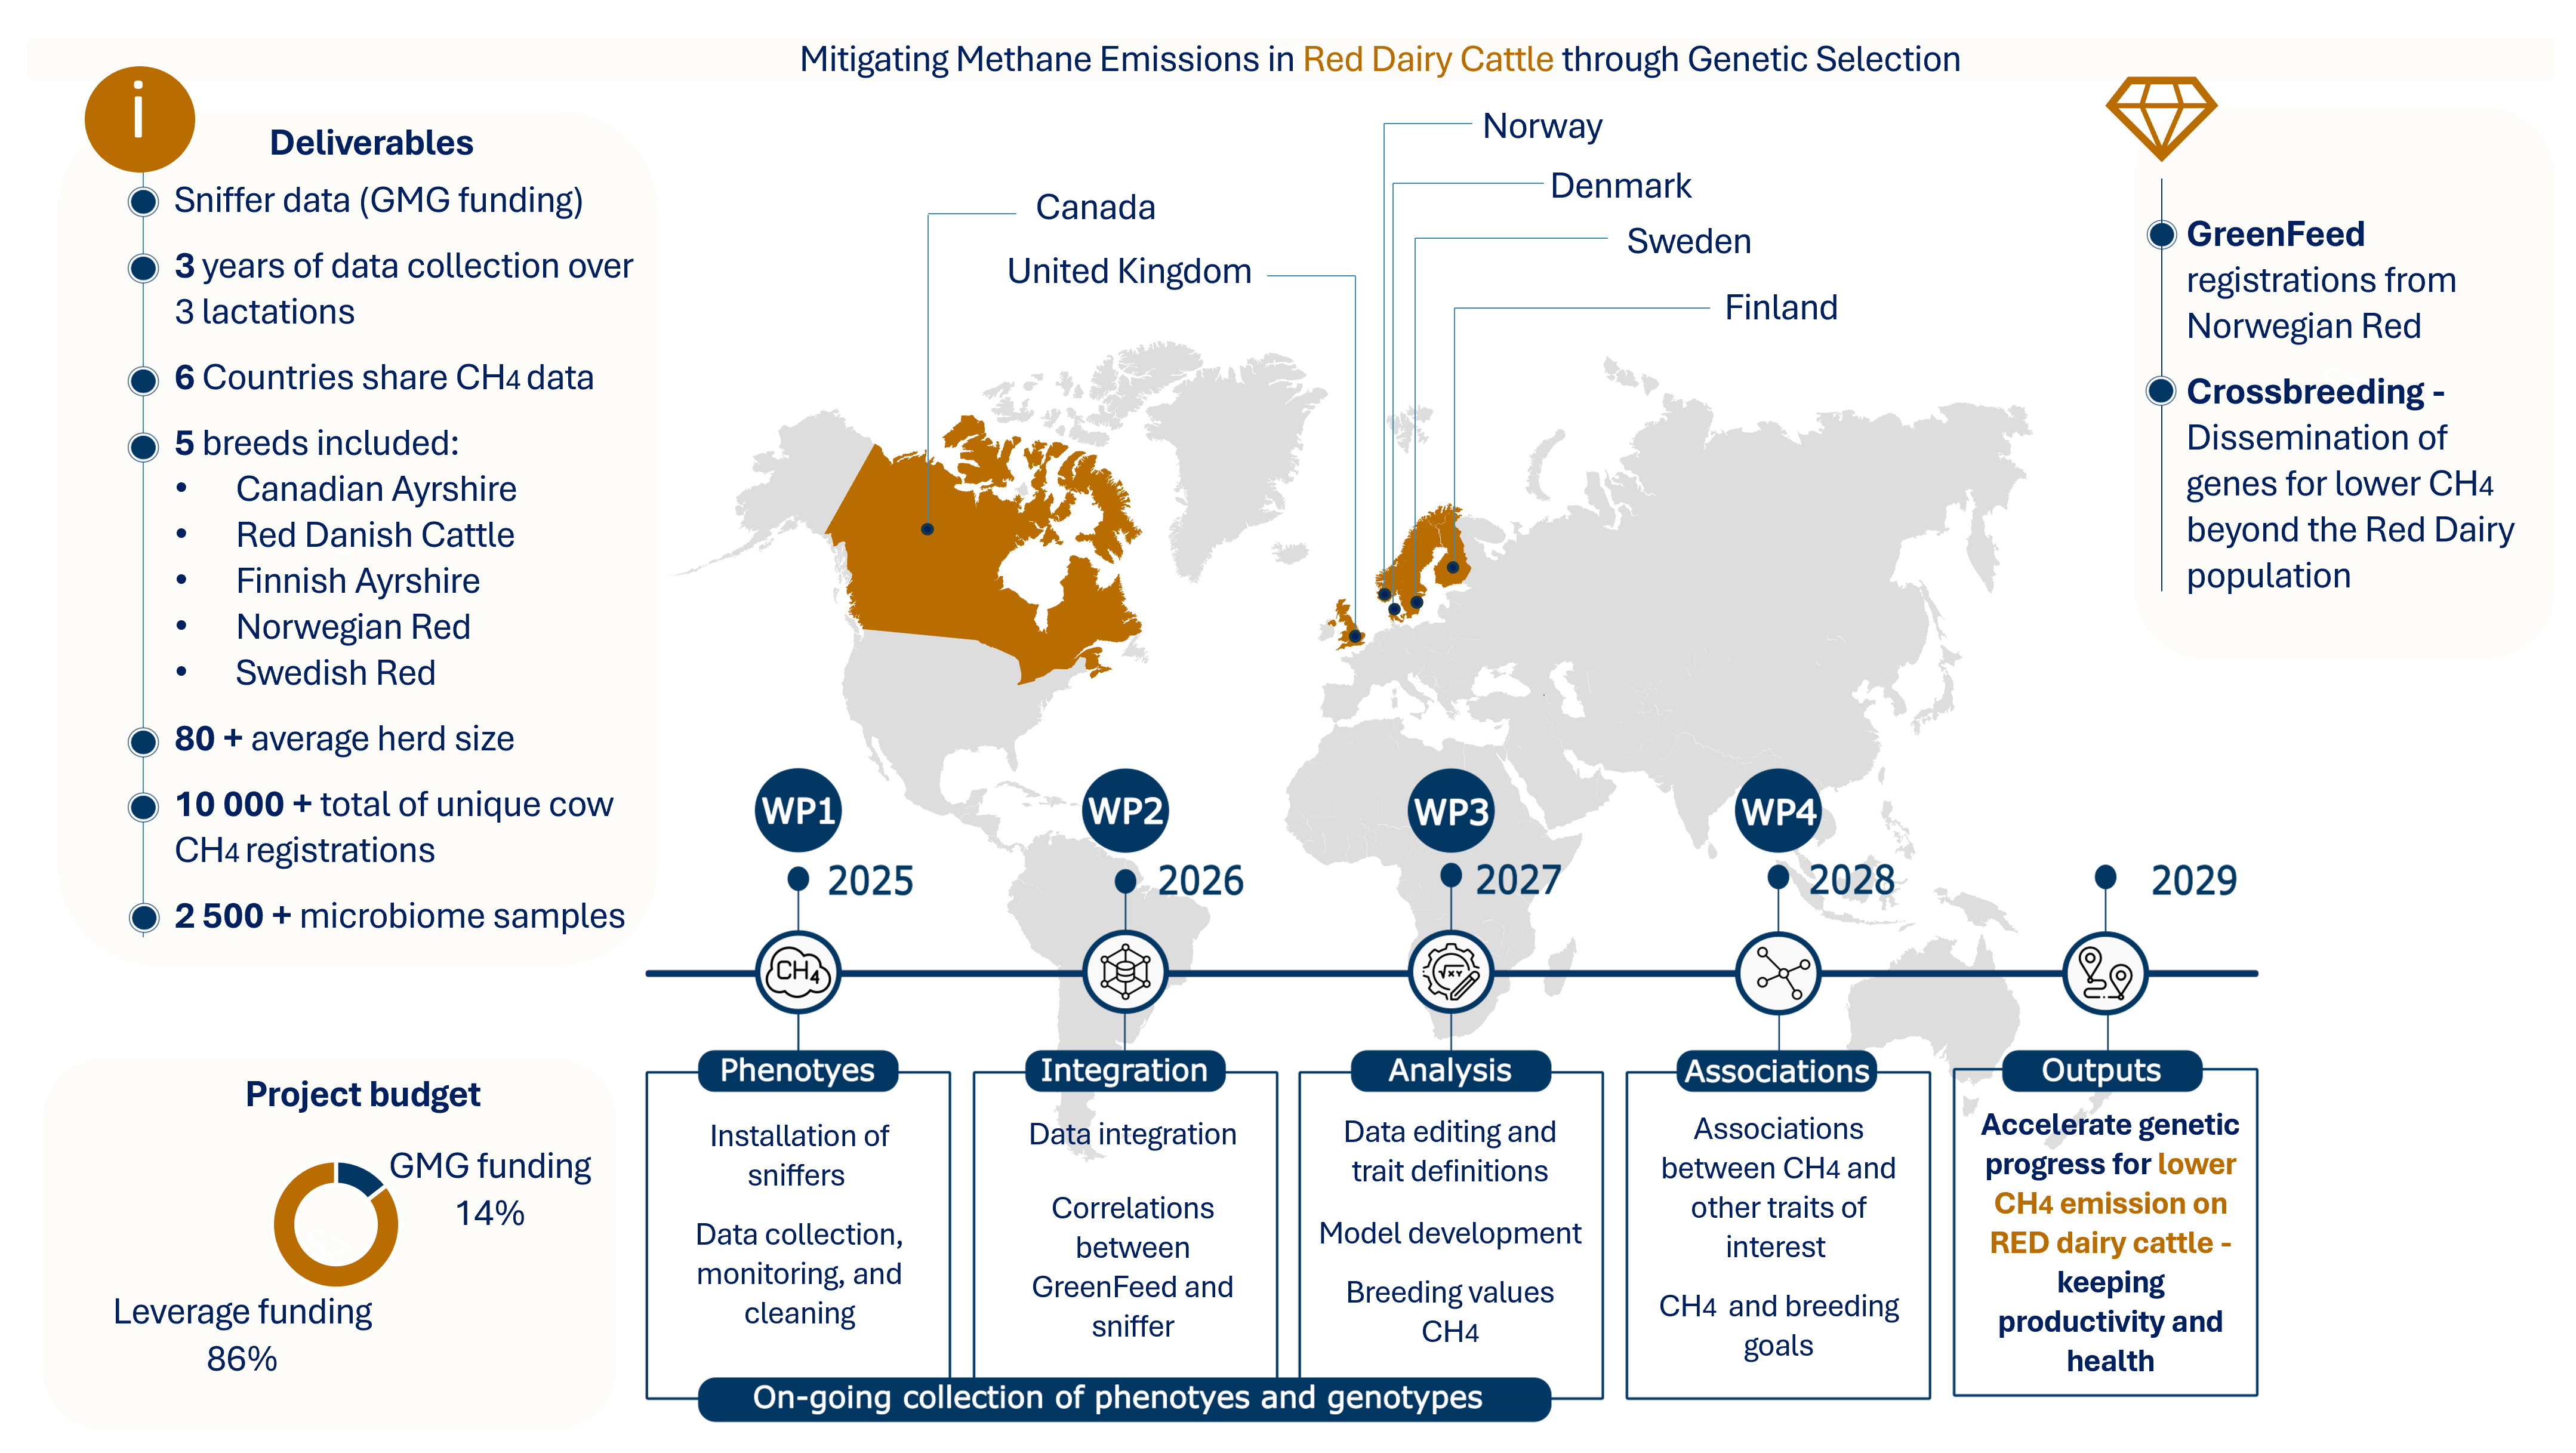
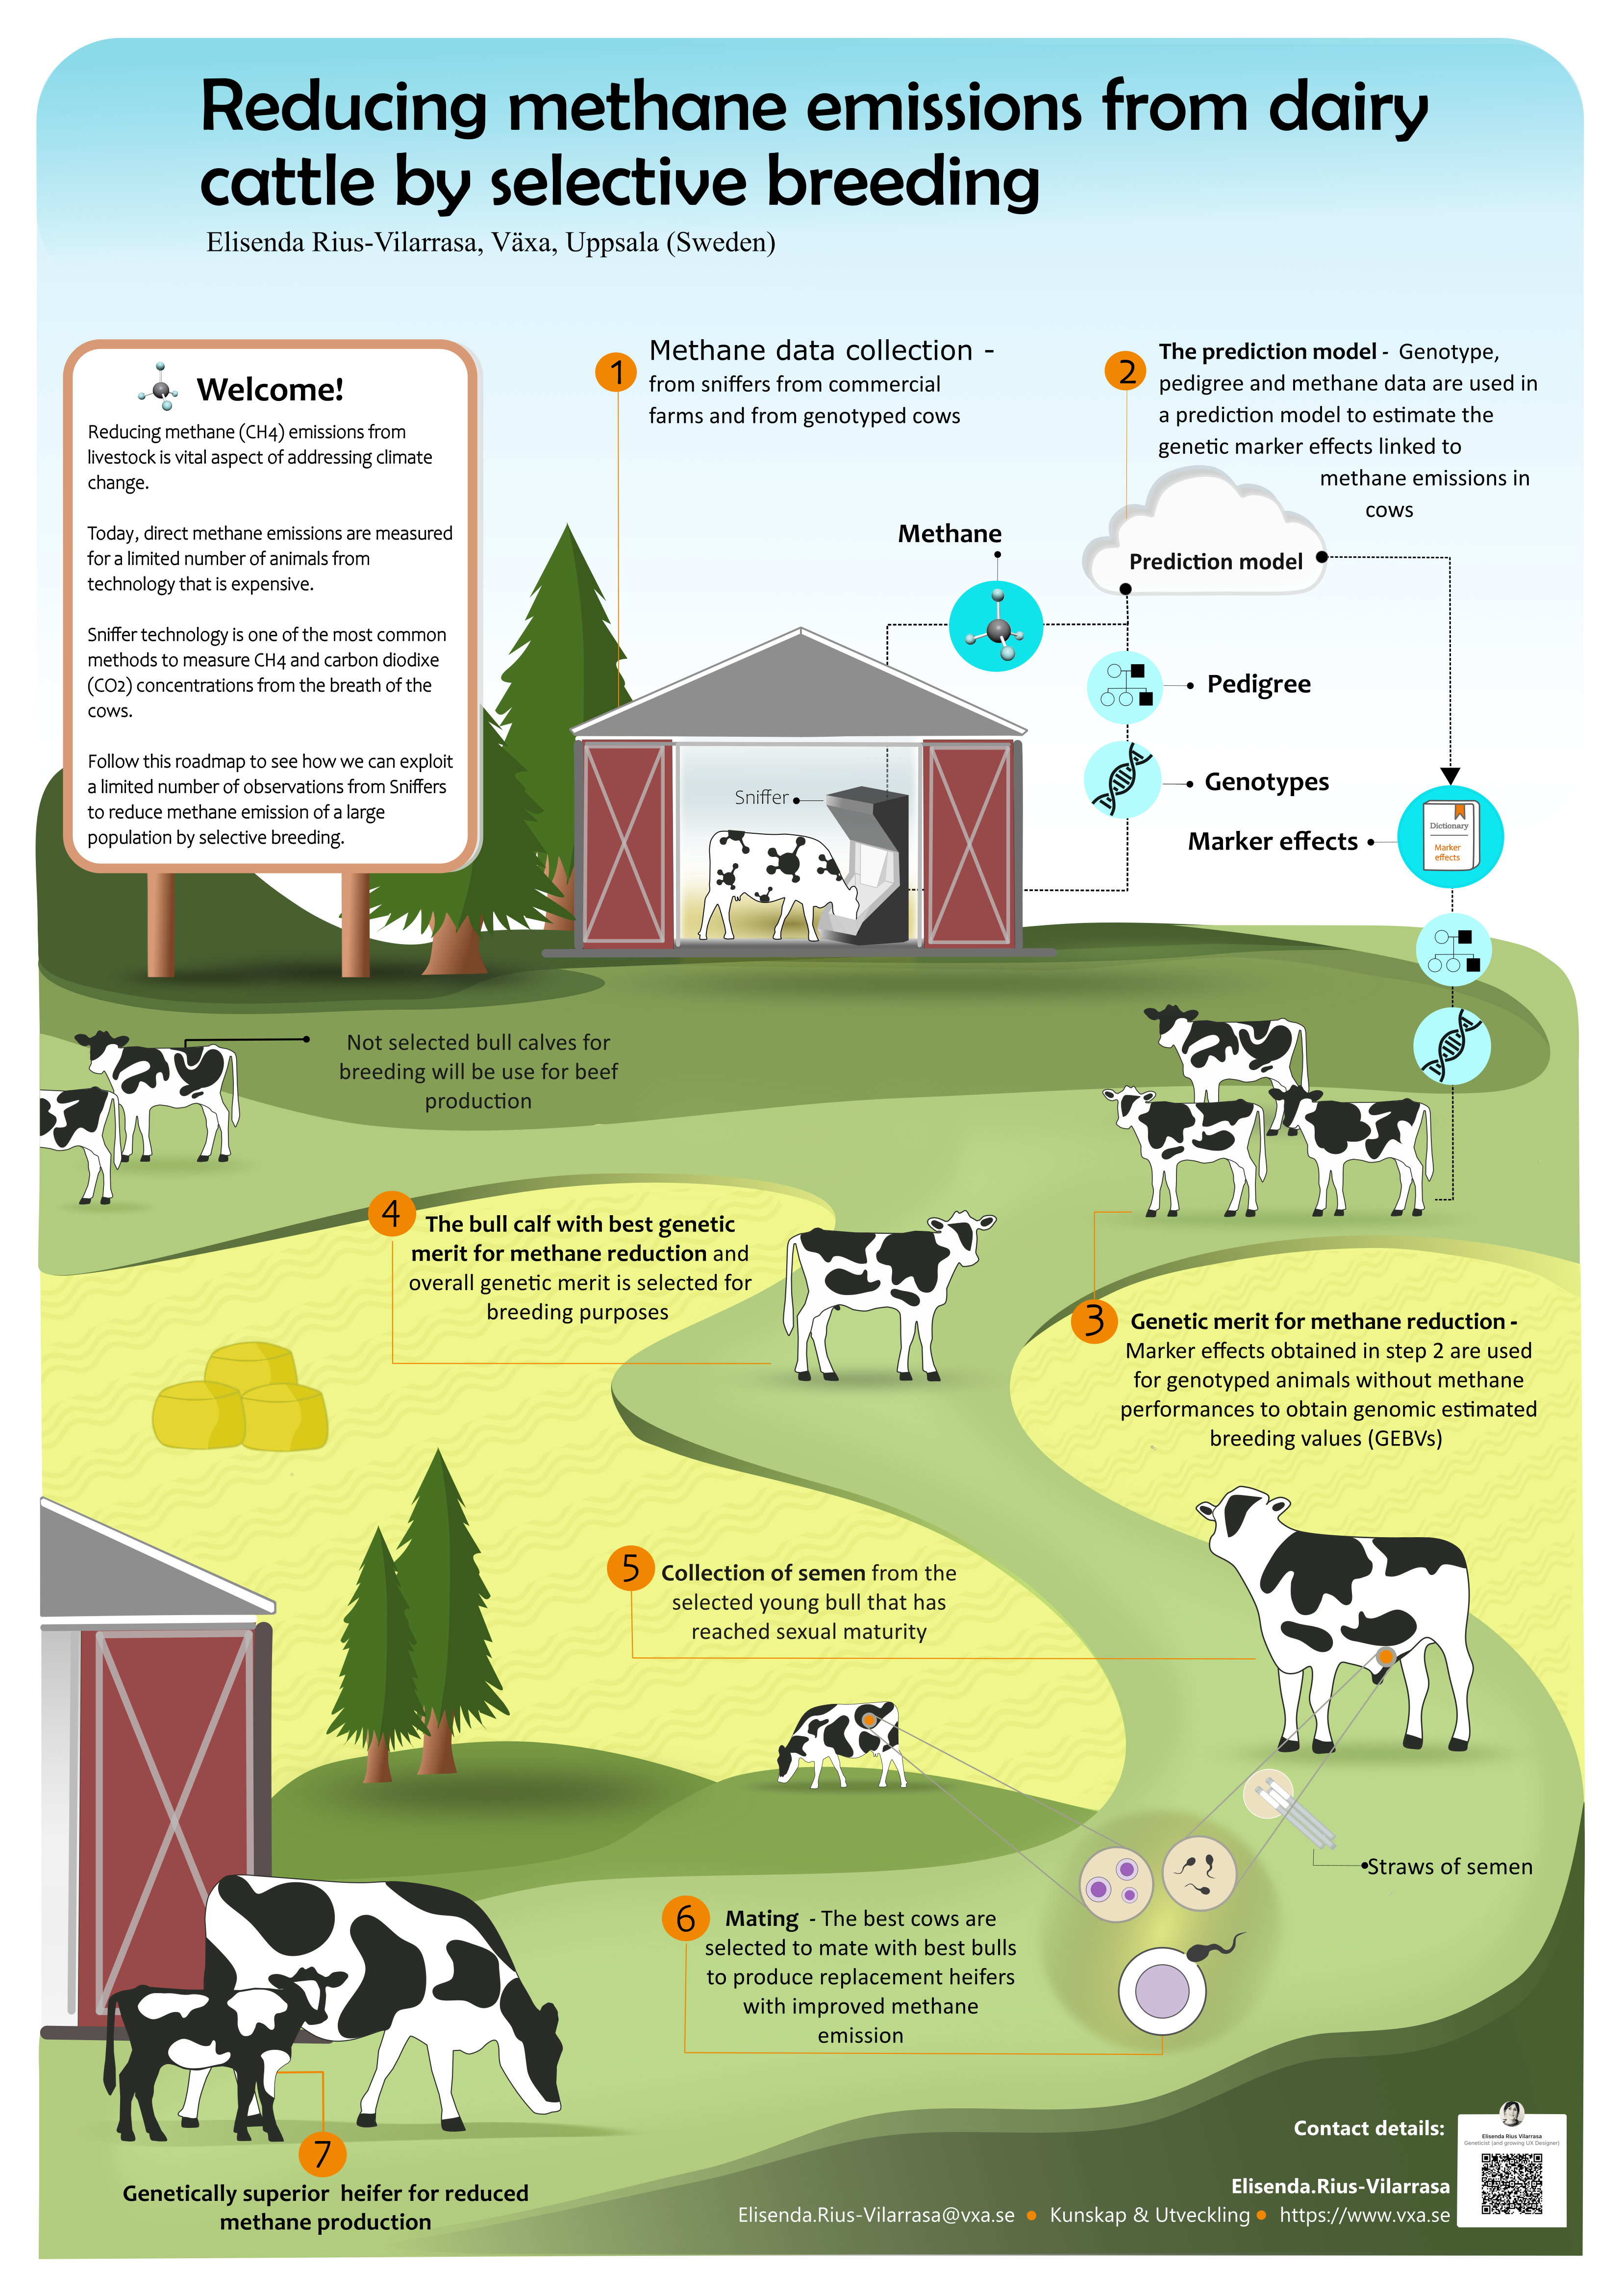
Animal Breeding & Genetics

Specialized visuals for genomics, animal breeding, quantitative genetics, and related scientific domains.

Storytelling example
Adenine (A)
Thymine (T)
Guanine (G)
Cytosine (C)
A always pairs with T  ·  G always pairs with C

Science-first.
Design-driven.

Every visualization begins with understanding the science — the data structure, the hypothesis, the audience. Design choices follow scientific logic, not the other way around.

With a background in animal science and data analysis, I bridge the gap between complex quantitative results and clear visual communication. Whether it's a genome-wide association study, a breeding value distribution, or a multi-trait correlation matrix — if it has structure, it has a visual story.

Start a project
Sample sequence — Bos taurus chromosome 6
001ATGACTGAACTGCTACGT
019GCATAGCTAGATCGATCG
037TAGCGATCAGTAGCTAGC
055ACTGATCGTACGATCGAT
073GTACGACTAGCTAGTACG
091TCGATAGCTACGTAGCTA

Let's Connect

Interested in working together or want to see more? Reach out — I'd love to hear about your project.